OT and OTA test
OT Test enables Total, free and combined chlorine in water
The reagent is ‘analytical grade Orthotolidine’, dissolved in 10% solution of HCl
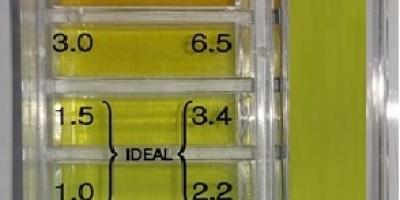
When this reagent is added to the water containing chlorine , it turns yellow
The intensity of yellow colour is proportional to the concentration of chlorine
This yellow colour is produced by both free and combined chlorine residuals
However, OT reacts with free chlorine instantaneously but reacts more slowly with combined chlorine
Add 0.1 ml of reagent to I ml of water
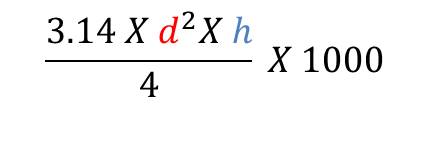 liters