Normal Distribution concerns quantitative variable e.g. systolic BP, birth weights, age at menarche etc.
Summary values of quantitative data are:
Mean and Standard deviation (SD),
Mode and
Median
Standard deviation (SD) summarizes the variation of a large sample
Variable is mostly distributed normally if:
The sample is fairly large and
The sample units have been chosen randomly i.e. the sample is a ‘random sample’
Normal Distribution (Gaussian Distribution)
After a large number of observations of a quantitative variable (e.g. systolic BP) have been taken from a large, random sample, a frequency distribution table has to be prepared using class (or group) intervals

Mean = 120 mmHg and Standard Deviation (SD) = 10
Mean ± 1 SD or 110 to 130 mmHg would include 68% of observations
Mean ± 2 SD (100 – 140mmHg) will include 95% of the subjects and
Mean ± 3 SD (90 – 150 mmHg) will include 99.5% of observations
Only 26 observations are lower than mean - 3 SD’s and
Only 7 – 15 observations are higher than mean + 3 SD’s
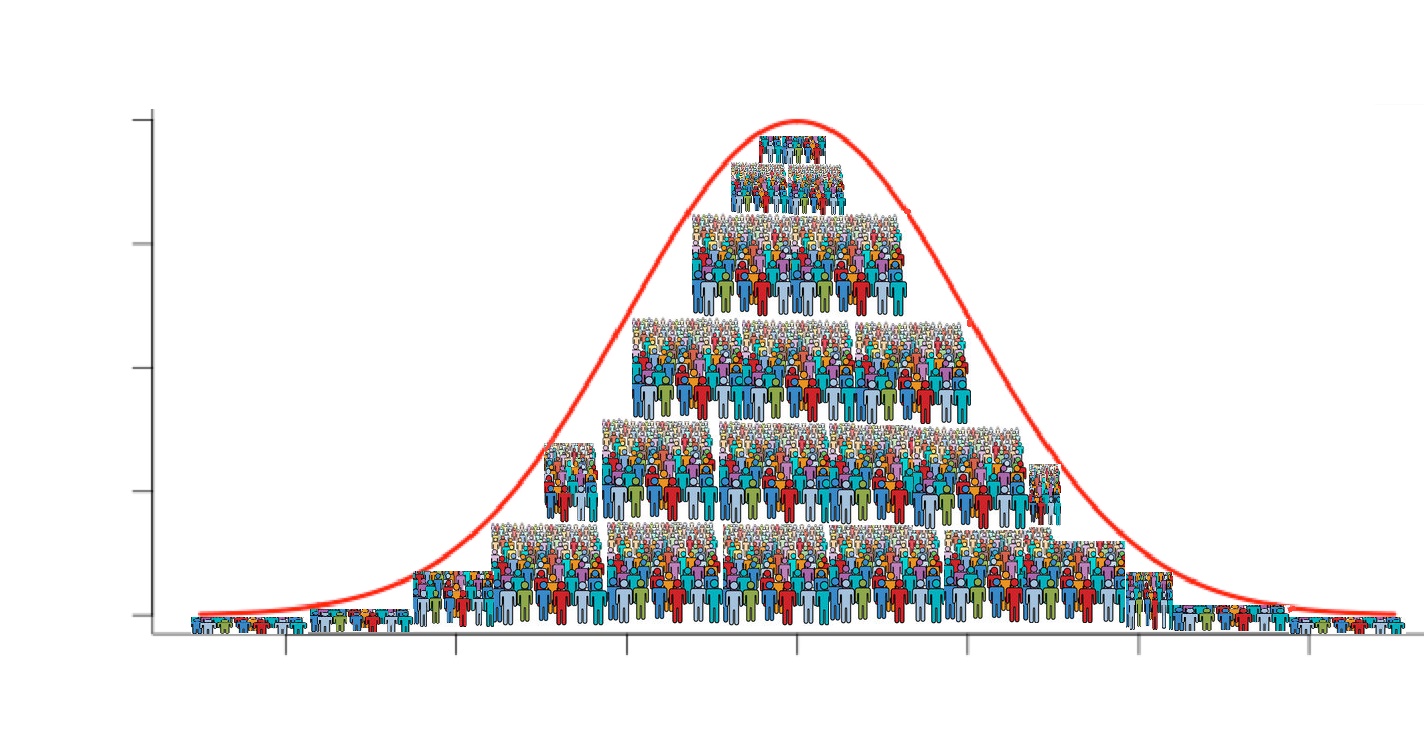
Normal Curve (Gaussian Curve)
A histogram is the graphical representation of quantitative data
The frequencies of the class intervals (number of subjects with values in the specified class interval) are plotted against the intervals on a graph
This plot looks like bars drawn WITHOUT space among them, as the data is continuous and hence are the class intervals are without break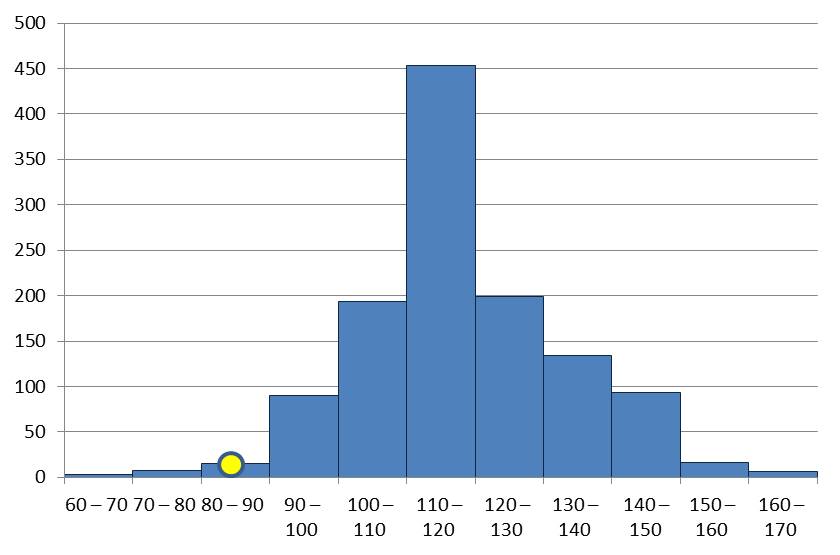
When the midpoints of the top of the bars are joined by drawing straight lines, we obtain a ‘frequency polygon’
Smoothened shape of this polygon is called ‘frequency curve’
The curve is smoothened when the same histogram is drawn with very reduced class intervals and then joining the midpoints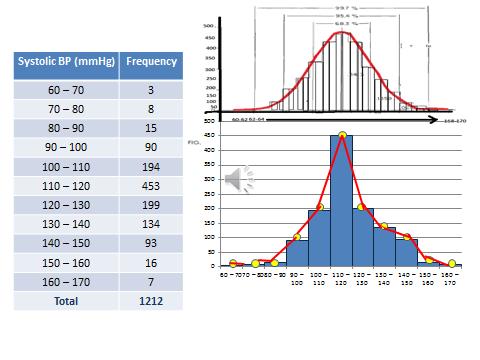
Characteristics of a Normal Curve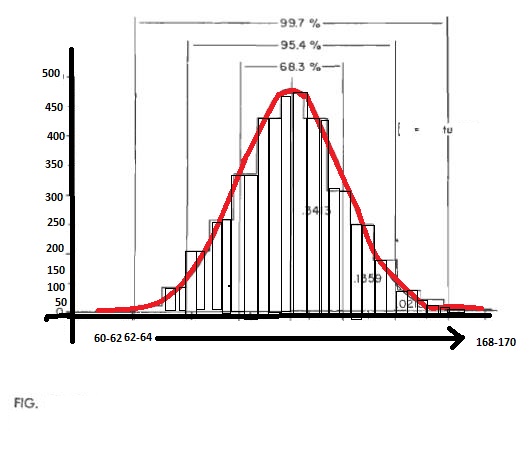
It is bell shaped
It is symmetrical bilaterally
Mean, mode and median coincide and = 0
It has two inflictions at the points where the curve changes from convexity to concavity
Mean ± 1 SD includes 68.27% of observations
Mean ± 2 SD will include 95% of the values and
Mean ± 3 SD will include 99.5% of observations
Standard Normal Deviate
The normal distribution and normal curve describe the distribution of quantitative variables like systolic BP, height, weight etc.
The Standard Deviation (SD) is the unit of distance from the mean
The variation of a value from the mean is expressed in terms SD
We say ‘by how many SD’s is an observation more than the mean?’ or ‘less than the mean?’
This is same as saying ‘by how many Z’s is an observation more than the mean (the ‘Z’ value of the observation) or
Lesser than the mean (the ‘–Z’ value)
(Observation -Mean)/SD = Z
Hence if Z=1: the observation (e.g. systolic BP of 130mmHg) is one SD higher than the mean
Z = -1: the observation (systolic BP of 110mmHg) is one SD lower than the mean
In a normal curve, the mean can be represented as ‘Zero’ and the SD as 1
Defining the Limits of Normality
By ‘normal’ we mean usual (the terms ‘normal’ and ‘abnormal’ are not strictly used in medical science)
The limits of the usual values found in the populations for a quantitative variable are decided using the mean and SD of a LARGE and RANDOM sample of apparently healthy individuals
We have seen that Mean ± 2 SD covers 95% of individuals’ values
The remaining 5% lie outside this range (2.5% below ‘Mean – 2 SD’ and 2.5% above ‘Mean + 2 SD’)
Internationally Mean ± 2 SD have accepted as the limits of the ‘normal range’
By defining ‘normal’ like this, we run the risk of wrongly excluding 5% of healthy subjects as abnormal
But they have only 5% chance of being normal, hence should be thoroughly worked up to rule out any disease
E.g. an apparently healthy woman had a pulse rate of 50 bpm
The clinical examination and investigations showed no abnormality
She probably is among those 2.5% of the healthy individuals whose value is Mean - 2 SD
References
Health Information and Basic Medical Statistics: Park’s TB of Preventive and Social Medicine, ed. K. Park, 23rd edition, 2016
Methods in Biostatistics, B.K Mahajan, Jaypee Brothers Medical Publishers, New Delhi
Biostatistics: K Visweswara Rao, Jaypee Brothers Medical Publishers, New Delhi