(adsbygoogle = window.adsbygoogle || []).push({
google_ad_client: "ca-pub-2296304216845141",
enable_page_level_ads: true
});
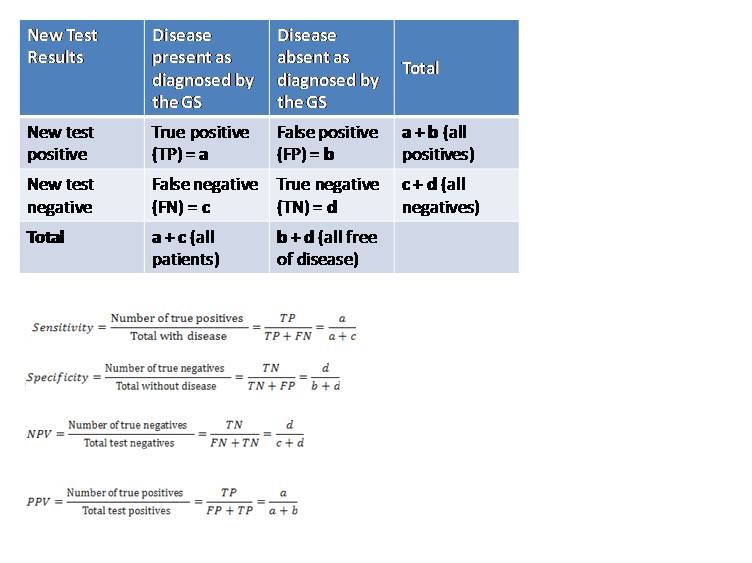
There is usually a “Gold Standard” against which a new test is compared. It is assumed that all those found positive by using the “Gold Standard” (GS) actually have the disease and the ones reported as negative do not have the disease.
The most accurate diagnostic test for the disease at that particular point in time is taken to be the GS. For example, positive urinary culture is GS for diagnosing urinary tract infection. Similarly, positive salmonella blood culture is GS for diagnosis of typhoid fever.
.Hence, the samples reported as positive by both, the new test as well as the GS, are True positives (TP).
.Those reported as positive by only the new test and not by the GS are False positives (FP).
.Similarly, the samples reported as negative by both, the new test as well as the GS, are True negatives (TN).
.Those reported as negative by only the new test and positive by the GS are False negatives
SENSITIVITY
Sensitivity is defined as the ability of the test to detect all those with disease in the screened population.
This is expressed as the proportion of those with disease correctly identified by a positive screening test result.![]()
Multiply by 100 to get sensitivity in percentage.
Sensitivity answers the question: “What percentage of patients will be picked up by the test under evaluation?”
SPECIFICITY
Specificity is defined as the ability of the test to identify correctly those free of disease in the screened population.
This is expressed as the proportion of those without disease correctly identified by a negative screening test result.![]()
Multiply by 100 to get specificity in percentage.
Specificity answers the question: “What are the chances that the test will not report positive in any condition other than the disease intended to diagnose?”
POSITIVE PREDICTIVE VALUE
The PPV describes the probability of having the disease given a positive screening test result in the screened population.
This is expressed as the proportion of those with disease among all screening test positives.![]()
PPV answers the question: “If a test report is positive, what are the chances that the individual actually has the disease?”
NEGATIVE PREDICTIVE VALUE
The NPV describes the probability of not having the disease given a negative screening test result in the screened population.
This is expressed as the proportion of those without disease among all screening test negatives.![]()
Multiply by 100 to get NPV in percentage.
NPV answers the question: “If a test report is negative, what are the chances that the individual does not actually have the disease?”
EFFECT OF DISEASE PREVALENCE ON SCREENING VALUES
Sensitivity and specificity are independent of prevalence of disease, i.e., these values are fixed for the particular test (they describe how well the screening test performs against the GS). These values will remain the same for the same test in different populations.
PPV and NPV are dependent upon the prevalence of the disease in the population studied, i.e., population specific. These values will change for the same test in different populations.
PPV and NPV give information on how well a screening test will perform in a given population with a specific prevalence.
A higher prevalence will increase the PPV and decrease the NPV.
By the same logic, a lower prevalence will increase the NPV and decrease the PPV
References:
Poornima Tiwari. Screening In: Mastering Practicals in Community Medicine. 2nd Ed. Gurugram, Lippincott William & Wilkins
Health Knowledge. Diagnosis and screening. Available at: http://www.healthknowledge. org.uk/ public-health-textbook/disease-causation-diagnostic/2c-diagnosis-screening/statistical-aspects- screening. Accessed January 24, 2012. Park K. Screening for disease. In: Park’s Textbook of Preventive and Social Medicine, 20th ed. Jabalpur, Madhya Pradesh: M/S Banarasidas Bhanot Publishers; 2009.
(adsbygoogle = window.adsbygoogle || []).push({
google_ad_client: "ca-pub-2296304216845141",
enable_page_level_ads: true
});
Steps in Investigation of an Epidemic: http://www.ihatepsm.com/blog/epidemiology-steps-investigation-epidemic
Tests of Significance: http://www.ihatepsm.com/blog/epidemiology-tests-significance
Monitoring and Evaluation: http://www.ihatepsm.com/blog/epidemiology-monitoring-and-evaluation
Advantages and Disadvantages of Case Control Studies: http://www.ihatepsm.com/blog/epidemiology-advantages-and-disadvantages-c...
Advantages and disadvantages of cohort study: http://www.ihatepsm.com/blog/epidemiology-advantages-and-disadvantages-c...
Basic Concepts in Epidemiology: http://www.ihatepsm.com/blog/epidemiology-basic-concepts
Types of Epidemiological Studies: http://www.ihatepsm.com/blog/epidemiology-types-epidemiological-studies
Differences between Case – control and cohort study: http://www.ihatepsm.com/blog/epidemiology-differences-between-case-%E2%8...
Uses of epidemiology: http://www.ihatepsm.com/blog/epidemiology-uses-epidemiology
Blinding in Experimental Studies: http://www.ihatepsm.com/blog/blinding-experimental-studies
Evaluation of a Screening Test: http://www.ihatepsm.com/blog/epidemiology-evaluation-screening-test