It is one of the easiest and most popular methods for conducting a dietary survey. Studies have revealed that if properly conducted, the 24-hour recall method reveals reliable information regarding the food intake amount and quality.
The interviewer asks the homemaker to recall all the foods consumed by the family in the past 24 hours. Assuming that the interview is done during late morning hours, e.g. 11 a.m. to 12 p.m., the individual is asked to think back in time and recall what was cooked and consumed for the breakfast on the day of the interview, for the dinner last night, and the lunch on the previous day. In short, it meant enquiring about all the food consumed after the previous morning's breakfast.
It is suggested that the recall should begin from the most recent meal and proceed backward in time.
In the first step, the individual is asked to recall the items consumed during the last 24 hours.
After this, the amount that was consumed is probed. This has to take into account the leftover portion which is to be deducted from the total amount cooked.
In the third step, the amount of each raw ingredient that went into cooking of the items is asked. Food models and household measuring instruments can be used to guess the portion sizes more accurately. Also, she/he can be asked to demonstrate the spoon and cups which were used to measure the particular ingredient. The interviewer can assess the volume by filling it with water and pouring the same in a measuring cup. It is a good idea to carry measuring spoons set and other measuring instruments such as measuring cups and cylinders.
Also examine the packages of the prepackaged food items consumed. Read the nutritional information per unit provided on these and note down the amount actually consumed out of these packets.
Some measures are suggested to obtain complete and truthful information:
• Explain to the homemaker that you need to know only what was actually eaten.
• Do not express either approval or disapproval of any food item that is mentioned, either by way of words or by facial expressions. Do not appear to be judgmental about any dietary item being “good” or “bad” No one can eat only the approved foods all the time.
• Do not ask leading questions that may suggest the homemaker that the family “should” have consumed a certain item and lead her/ him to say, “Yes, we did”
Some items such as chapattis and bread slices can be listed in terms of the number consumed.
The homemaker can also be requested to display the amount of flour that she would usually use for making 10 typical chapattis. One can guess the raw flour weight used for one chapatti. The number of calories in each chapatti consumed in the family can then be calculated on the basis of this amount. For bread slices, the amount and ingredients can be read off the label.
The amount of rice, wheat flour, pulses, vegetables, etc., is entered in a table.
An example from a student's record book is given in the table below.
Once the data are collected, thank the homemaker for her/his cooperation and the further analysis is to be done by the investigator.
Table for Recording During a 24-Hour Recall (Questionnaire) Method of Dietary Survey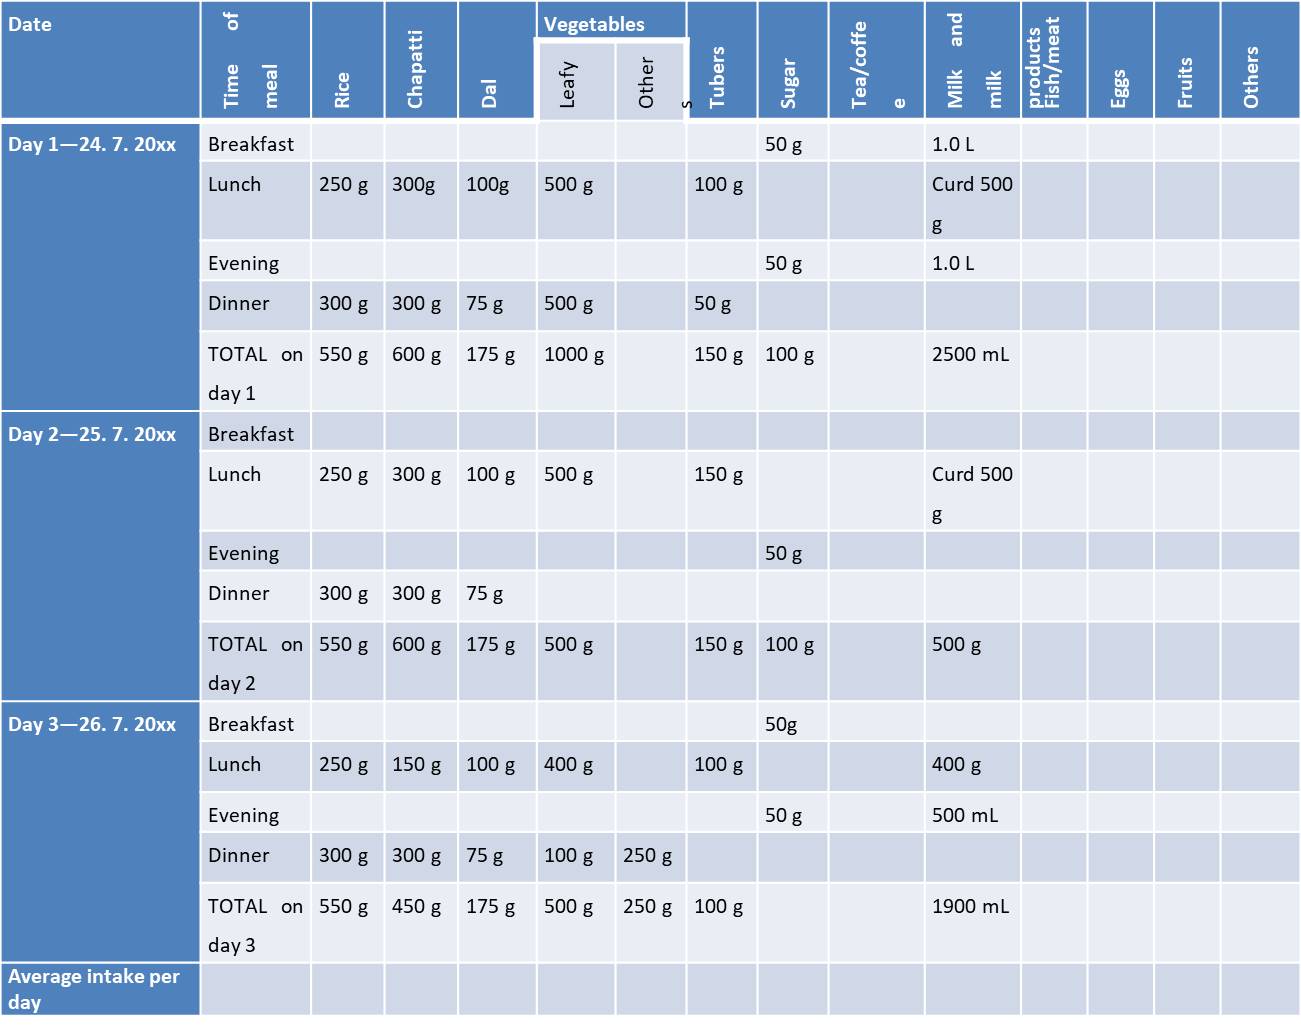
This is repeated for one “dietary cycle” which is of 7 days. All the days must be different days of the week. This is done to avoid the effect of any atypical food consumption on a particular day of the week like weekly fasts or feasts.
If it is not possible to cover 7 days, an undergraduate student is expected to repeat for at least 3 different days of the week.
The average intake per day by the family is calculated by adding up the quantities consumed on each day and then dividing the sum by the number of days of survey.
In the next step, the average daily intake of food stuff is converted into
• Principal food categories, e.g., grams of cereals per day, grams of pulses per day, and grams of leafy vegetables per day by the family.
• Amount of nutrients consumed by the family in a day. Nutrients which are calculated are calories (energy), proteins, fat, vitamins, calcium, and iron consumed per day. For this step, help is taken from the food tables given in the ICMR publication Nutritive Value of Indian Foods.
Calculation of intake per Consumption Unit can be done as is practiced in the nutritional surveys done in India by the NNMB.
Once the family's average daily intake is obtained, the next step is to calculate the number of Consumption units (CUs) in the family and divide the average amount of each food item and nutrient by the CUs to obtain the intake per CU by the family.
Concept of Consumption Unit: http://www.ihatepsm.com/blog/concept-%E2%80%9Cconsumption-unit%E2%80%9D
In the family of the given example, there were 3.5 CUs.
The average intake (of food categories and nutrients) by the family is divided by the number of CUs to obtain the average intake per CU. This intake of each food group (or category) and nutrient per CU is compared against that recommended by the ICMR for the sedentary man (i.e., the RDA for one CU). The percentages by which the daily intake per CU of each item of food categories and nutrients is lower or higher than the RDA for a sedentary man (CU = 1) are calculated. These are also plotted on a bar graph for better visual comparison with the RDA.
One example is given from the records of a student in the following two tables.
Table Showing Comparison of Food Categories Consumed per CU with the RDA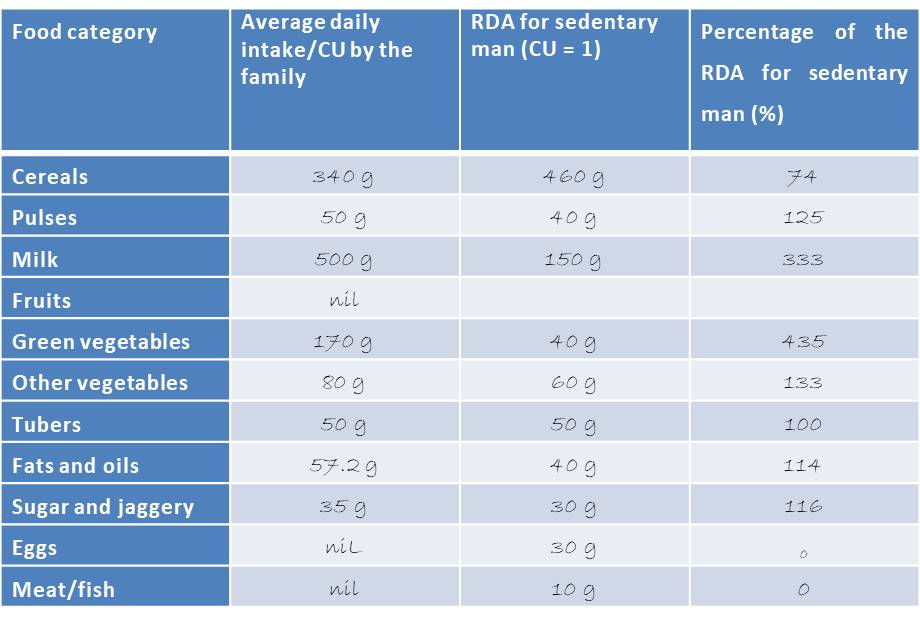
Table showing Conversion of per CU Food Category Intake into Nutrient Intake per CU and Comparison with the RDA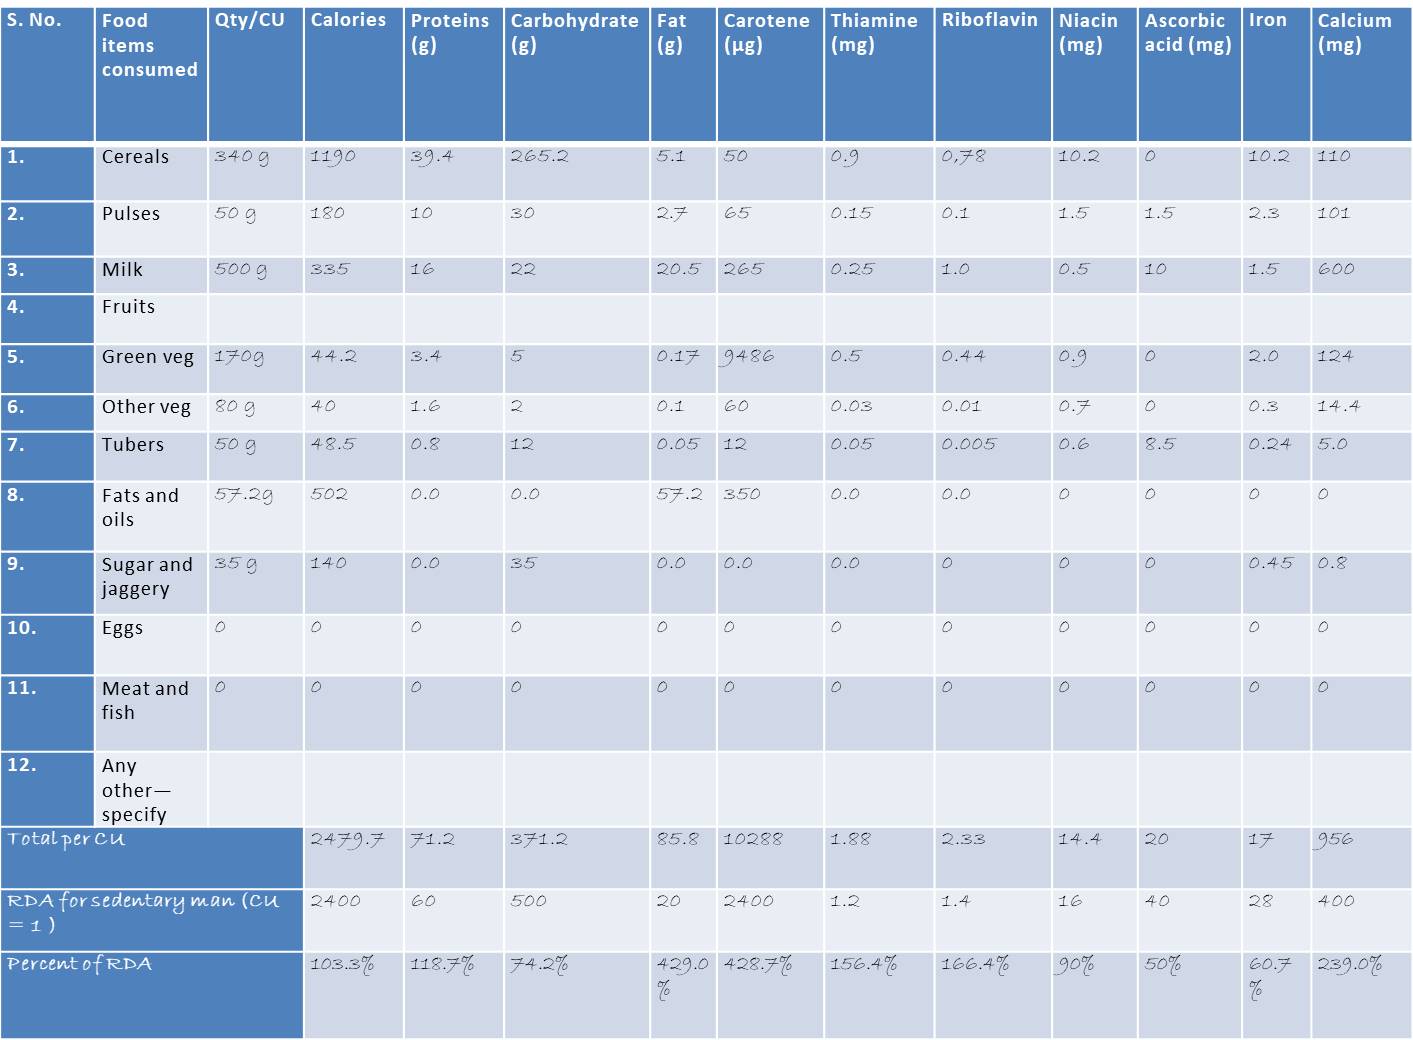
Once the food categories and nutrient intake is calculated as the percent of RDA, graphs can be plotted as shown in an example from a student's record (as shown in the figure below).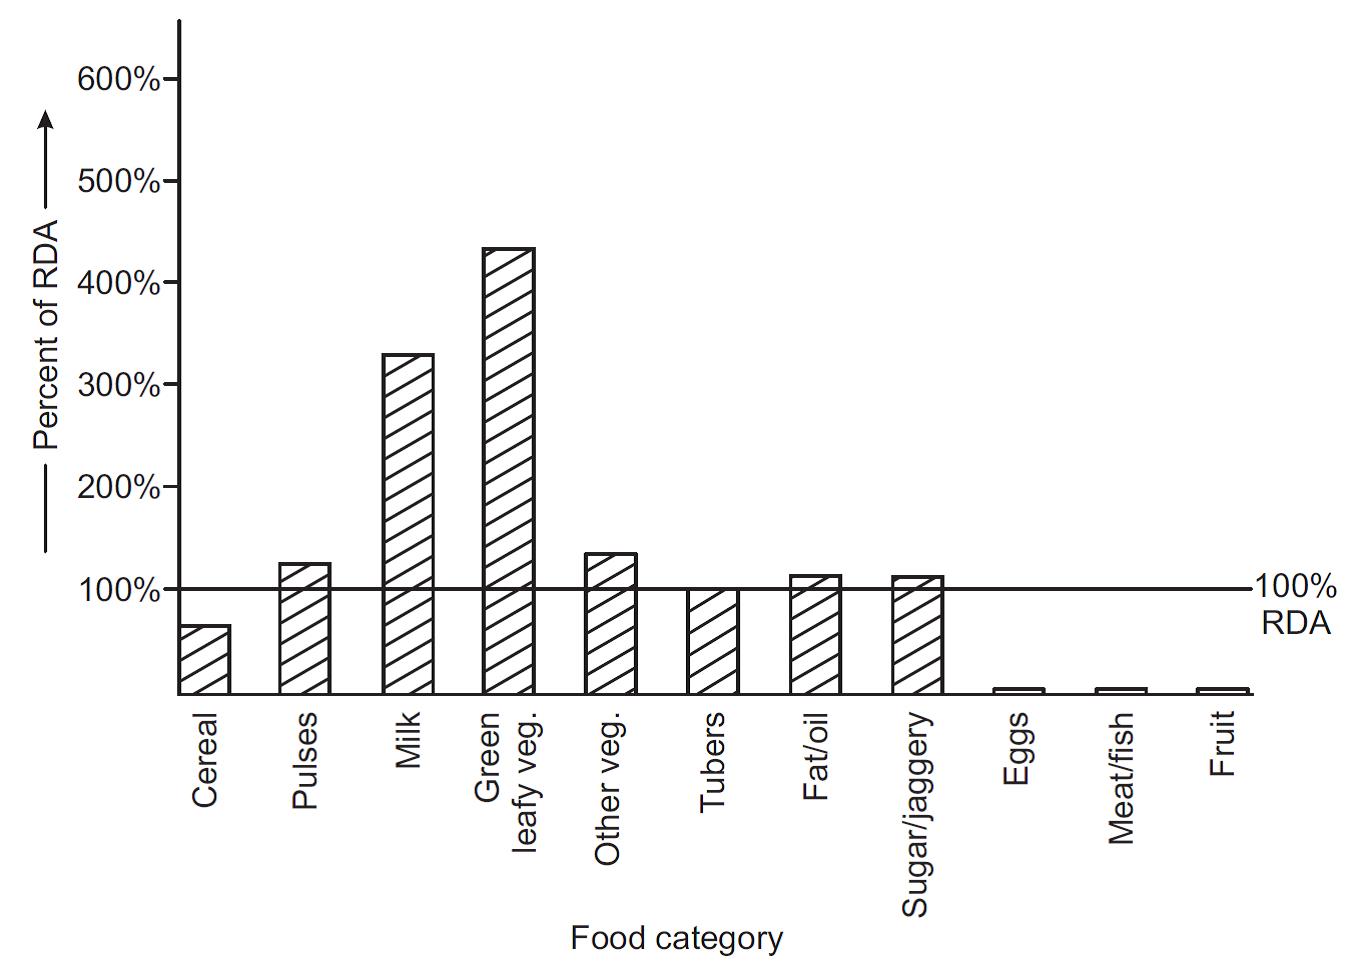
Figure showing Food category intake per CU as percent of RDA
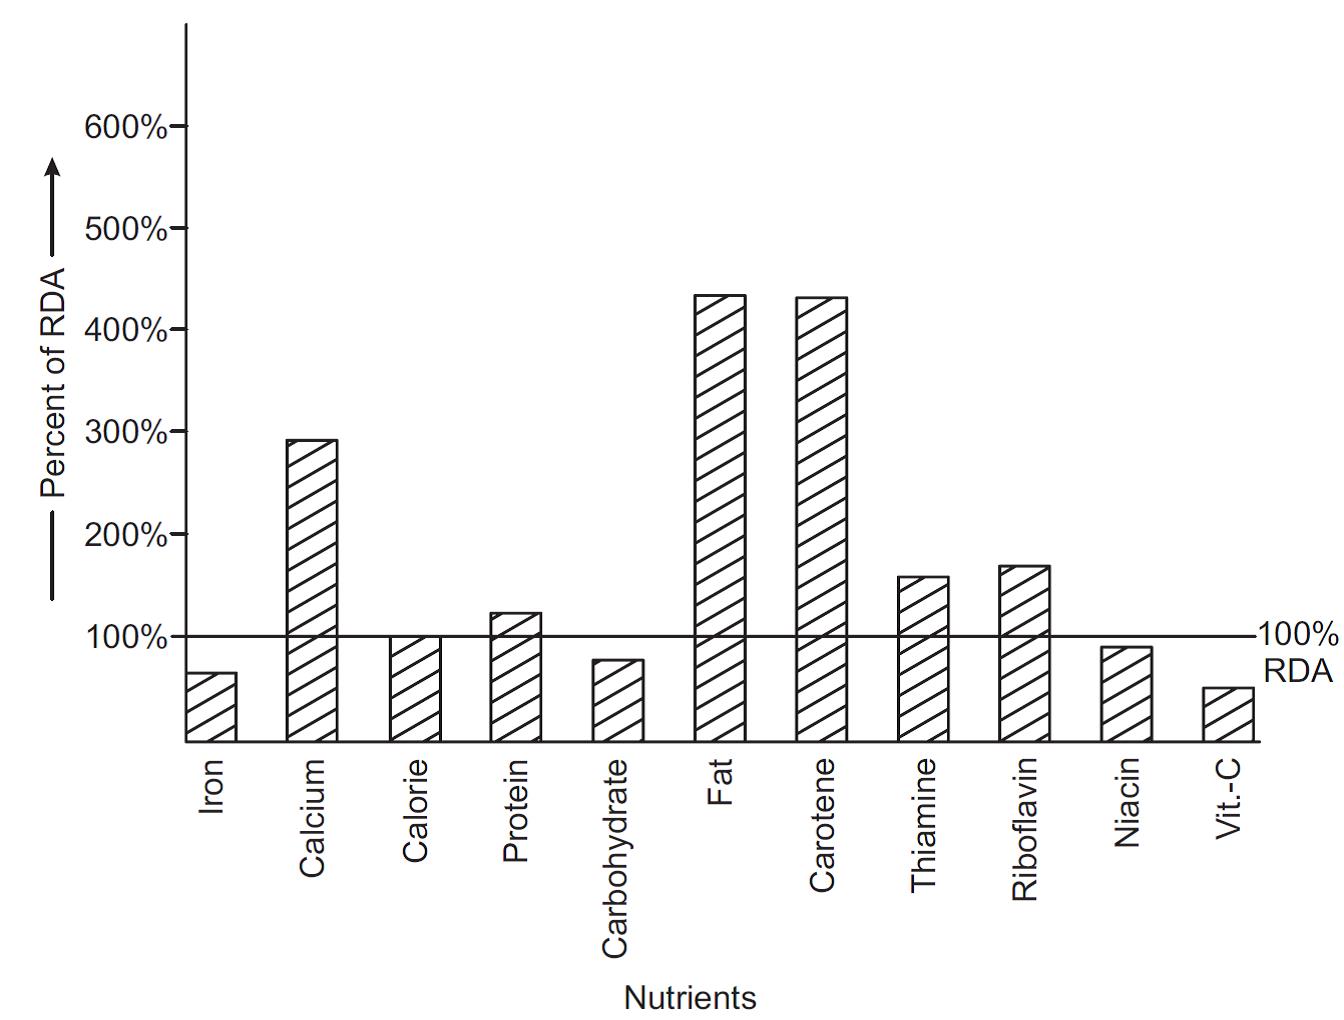
Figure showing Nutrient intake per capita as percent of RDA.
In addition to the dietary assessment of the family per CU, an assessment of the dietary intake by the nutritionally high-risk individuals of the family (e.g., pregnant female, lactating mother, and under-5 child) is also done and plotted on graphs in a similar manner.
This is also done by 24-hour recall method for a minimum of 3 days. The pregnant/lactating lady (or the parent in case of an under-5 child) is asked about the food consumed in the last 24 hours. The data collected during these days are converted into mean intake per day and then translated into daily intake of
• Food items in terms of cereals, pulses, etc. Average intake per day is calculated for each food category (in grams)
• Nutrients
These are compared against the ICMR’s RDA for pregnant/lactating woman or under-5 children, respectively.
Additional graphs comparing food items and nutrients’ intake with the RDA are plotted for these individuals also.
References:
1. ICMR. Nutrient Requirements and Recommended Dietary Allowances for Indians. Hyderabad: National Institute of Nutrition; 2009.
2. ICMR. Nutritive Value of Indian Foods. Hyderabad: National Institute of Nutrition; 1996.
3. Nutrition in India. UN ACC/SCN Country case study supported by UNICEF Annex I: food consumption data: the national nutrition monitoring bureau and national sample survey organization. Available at: http://www.unsystem.org/scn/archives/india/ch13.htm. Accessed January 13, 2012.
4. Gupta RK. Nutritional assessment and surveillance of a community. In: Vaidya R, Tilak R, Gupta R, Kunte R, editors. Text Book of Public Health and Community Medicine, 1st ed. Pune: Dept. Community Medicine, AFMC, in collaboration with WHO, India office, Delhi; 2009.
5. Park K. Nutrition and health. In: Park’s Textbook of Preventive and Social Medicine, 20th ed. Jabalpur, India: M/S Banarasidas Bhanot Publishers; 2009.
6. Poornima Tiwari, Shashank Tiwari. Chapter 12, In: Mastering Practicals in Community Medicine. 2nd ed. Lippincott Williams & Wilkins, New Delhi
7. Toobert DJ, Strycker LA, Hampson SE, et al. Computerized portion-size estimation compared to multiple 24-hour dietary recalls for measurement of fat, fruit, and vegetable intake in overweight adults. J Am Diet Assoc 2011;111(10):1578–83.
8. Sharma M, Rao M, Jacob S, Jacob CK. Validation of 24-hour dietary recall: a study in hemodialysis patients. J Ren Nutr 1998;8(4):199–202.
9. USDA, National Institute of Food and Agriculture. Procedures for collecting 24-hour food recalls. Available at: http:// www.csrees.usda.gov/nea/food/efnep/ers/ documentation/24hour-recall.pdf. Accessed January 12, 2012.
Modified Kuppuswamy Classification of Socio - Economic Class: http://www.ihatepsm.com/blog/modified-kuppuswamy-scale
Prasad's Scale: http://www.ihatepsm.com/blog/prasad%E2%80%99s-scale
Dependency Ratio: http://www.ihatepsm.com/blog/dependency-ratio
Assessment of Overcrowding in a Household: http://www.ihatepsm.com/blog/assessment-overcrowding-household
Checking Adequacy of Lighting in a Room: http://www.ihatepsm.com/blog/checking-adequacy-lighting-room
Assessment of Adequacy of Ventilation: http://www.ihatepsm.com/blog/assessment-adequacy-ventilation
Family and the Types of Family: http://www.ihatepsm.com/blog/family-and-types-family
Checking for Mosquito Breeding Areas in a Household: http://www.ihatepsm.com/blog/checking-mosquito-breeding-areas-household
Life Cycle of Housefly: http://www.ihatepsm.com/blog/life-cycle-housefly
Types of Piped Water supply: http://www.ihatepsm.com/blog/types-piped-water-supply
Reference Indian Adult Man and Woman: http://www.ihatepsm.com/blog/reference-indian-adult-man-and-woman
Concept of the “Consumption Unit”: http://www.ihatepsm.com/blog/concept-%E2%80%9Cconsumption-unit%E2%80%9D
Methods of Dietary Survey: http://www.ihatepsm.com/blog/methods-dietary-survey
24-Hour Recall (Questionnaire) Method: http://www.ihatepsm.com/blog/24-hour-recall-questionnaire-method
Determination of Socio-economic Status of a Family in a Rural Area (the Uday Pareekh Scale): http://www.ihatepsm.com/blog/determination-ses-family-rural-area-uday-pa...
7 Terms used in Maternal and Child Health: Definition and Explanation: http://www.ihatepsm.com/blog/7-terms-used-maternal-and-child-health-defi...
Terms used in Family Health Study: Definitions and Explanations: http://www.ihatepsm.com/blog/terms-used-family-health-study-definitions-...
(adsbygoogle = window.adsbygoogle || []).push({
google_ad_client: "ca-pub-2296304216845141",
enable_page_level_ads: true
});
Lecture on the definitions and explanations of terms used in Family Health Study: http://www.ihatepsm.com/resource/terms-used-family-health-study-definiti...
Hindi lecture on the definitions and explanations of terms used in Family Health Study: http://www.ihatepsm.com/resource/terms-used-family-health-study-definiti...
Hindi lecture on CSC taking: https://www.youtube.com/watch?v=9gvuXrIJ_gY&t=10s
English lecture on CSC taking: https://www.youtube.com/watch?v=rKxXIyJuBz8&t=24s
Format for CSC taking: http://www.ihatepsm.com/blog/format-clinico-social-case-taking-community...
Geriatric CSC taking: http://www.ihatepsm.com/blog/geriatric-clinico-social-case-community-med...
