If we want to measure a parameter of a population e.g. heights of the men in a city having 1,70,000 men:
One way can be that we measure the heights of ALL the 1, 70,000 men and calculate the mean.
This way we are sure we know the true mean of the population’s height (Population mean).
This may be a mammoth exercise and one may be hesitant in doing this.
So, mostly one chooses a sample from the study population, measures the heights of the participants and calculates the mean height of the sample.
The sample mean is at best an estimate of the population mean as we have examined only a portion of the entire population.
If another sample is studied, still another value of the mean height would be obtained.
If 100 samples are studied, we will obtain 100 sample means which do not exactly match either with each other or with the population mean.
These will fall in a range from smallest to largest value of sample means.
And the actual mean of the population would be somewhere in this range.
Lowest among the sample means < actual population mean < highest among the sample means
So we need to calculate a range of sample means in which the population mean is most likely to lie.
This range is known as the ‘Confidence Interval’
We don’t have to draw a hundred samples for calculating this ‘Confidence Interval’ or CI
We can calculate this range from our single representative sample only.
What is 95% Confidence Interval?
It means a range in which 95 of the 100 sample means would lie. So we can be 95% sure that the actual population mean would be somewhere between these two values.
Similarly, a 99% confidence interval is a range in which 99 out of the 100 samples means would fall.
A 90% confidence interval is a range in which 90 out of the 100 samples means would fall.
All these intervals can be calculated from a single study.
95% C.I. is the most commonly used with reasonable accuracy in determination of the population mean.
The width of the confidence interval is determined by:
1. Variation within the population
-More homogeneous the population, narrower the C.I. e.g. if the heights of the individuals in the sample is similar, the C.I. would be narrow.
-By virtue of the population being homogeneous, we reach a more precise estimation of the population mean.
2. Sample size
-Usually, larger the sample size, narrower would be the C.I.
-With increasing sample size we get closer to measuring the entire population
-Hence by drawing a larger sample, we can calculate the population-mean more precisely (narrower C.I.)
Confidence interval for assessing the prevalence of something (e.g. myopia) in a population
Prevalence is also studied mostly in a sample taken from the study population.
Again the actual prevalence of the population falls within the range calculated from the sample.
90%, 95%, 99% C.I hold the same meaning for this qualitative variable also.
How to calculate the confidence interval from the single sample?
The key step to this is calculating the ‘Standard Error’ or S.E. from the sample
We can be 95% sure that the actual value of the population would lie between the following values:
In other words, 95% C.I is:![]()
In case of quantitative data e.g. mean height of the study population,
95% confidence interval would be:![]()
In case of qualitative data e.g. prevalence of myopia in a population,
95% C.I. would be:![]()
How to calculate the Standard Error?
For quantitative data e.g. mean height of a population
What we derive from the sample consisting ‘n’ number of participants:
-Sample mean and
-Standard deviation (SD) of the sample
Using the above two, SE for quantitative data is calculated by the formula:
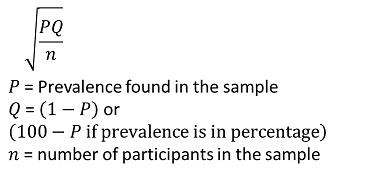
For qualitative data e.g. prevalence of myopia in a population
-What we derive is the prevalence in the sample (P)
And calculate the SE using the formula:
In short:
95% confidence interval for a mean value is: 
95% confidence interval for prevalence (P) is: 
Reference:
Mahajan's Methods in Biostatistics for Medical Students and Research Workers. 9th ed. Jaypee Bros. New Delhi
What is 'p-value': https://ihatepsm.com/blog/p-value-epidemiology-%E2%80%93-beginner%E2%80%...
video on p-value: https://www.youtube.com/watch?v=1O7U_Mc-AQ4
Video in HINDI on p-value: https://www.youtube.com/watch?v=ZU3MEGMc-18
What is 'Null - Hypothesis'? https://ihatepsm.com/blog/null-hypothesis-epidemiology-%E2%80%93-beginne...
video on Null Hypothesis: https://youtu.be/Xk1OWkD4d2M
HINDI video on Null Hypothesis: https://youtu.be/dfiE5x9pAjc
What is 'Confidence Interval'?: https://ihatepsm.com/blog/confidence-interval-%E2%80%93-beginner%E2%80%9...
