The steps lead to the calculation of the value of. x^2 for the study data
Value of the calculated x^2 is referred to the x^2 -table -where the ‘p’ value seen
Test can be applied:
a) On qualitative data
b) Random sample
c) The lowest observed frequency in all the cells is 5 or more
d) None of the observed values is zero
Advantages (over ‘SE of diff bet two means’ test):
a) Equally applicable for small samples and large samples
b) The test can be used even if there are >2 categories
Steps in Brief
Step-1: Make a contingency table mentioning observed frequencies (O) in all the cells.
Step-2: Determine the expected value (E) in each cell, as if ‘null hypothesis’ was true.
H0 assumes that the data is distributed due to chance alone and hence the proportions are exactly the same for both samples.
We arrive at this proportion by taking the combined proportion of both the groups and applying it to individual groups i.e. the exposed and non-exposed (cases or non-cases) or groups A & B
Step-3: Calculate the difference between the observed and expected value (O- E) in each cell
Step-4: Calculate the x^2 for each cell = ![]()
Step-5: Sum up the individual x^2 values of all the cells ; This is the value of x^2 for the whole table.
Step-6 : Determine the degree of freedom
d.f = degree of freedom = (c-1)(r-1); ‘c’ is the no. of columns and ‘r’ is the no. of rows in the table
Step-7: Refer to the x^2-table and note that ‘x^2’ value which is:
*Against the calculated degree of freedom and
*Under the p-value = 0.05
If calculated x^2- value is higher than that noted for p = 0.05 at the given D.F.; it implies that p<0.05 and the difference is significant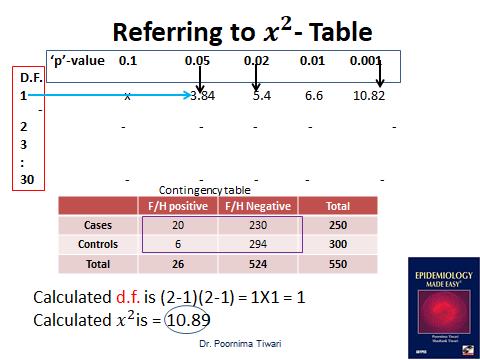
EXAMPLE – 1: Association B/W Family History of Breast Ca and Incidence of Breast Ca in Women
A case control study of 250 cases of breast carcinoma and 300 controls was carried out.
20 out of 250 cases had a positive family history and
6 out of 300 controls had a positive family history.
Is the difference significant?
Step-1: Construct A Contingency Table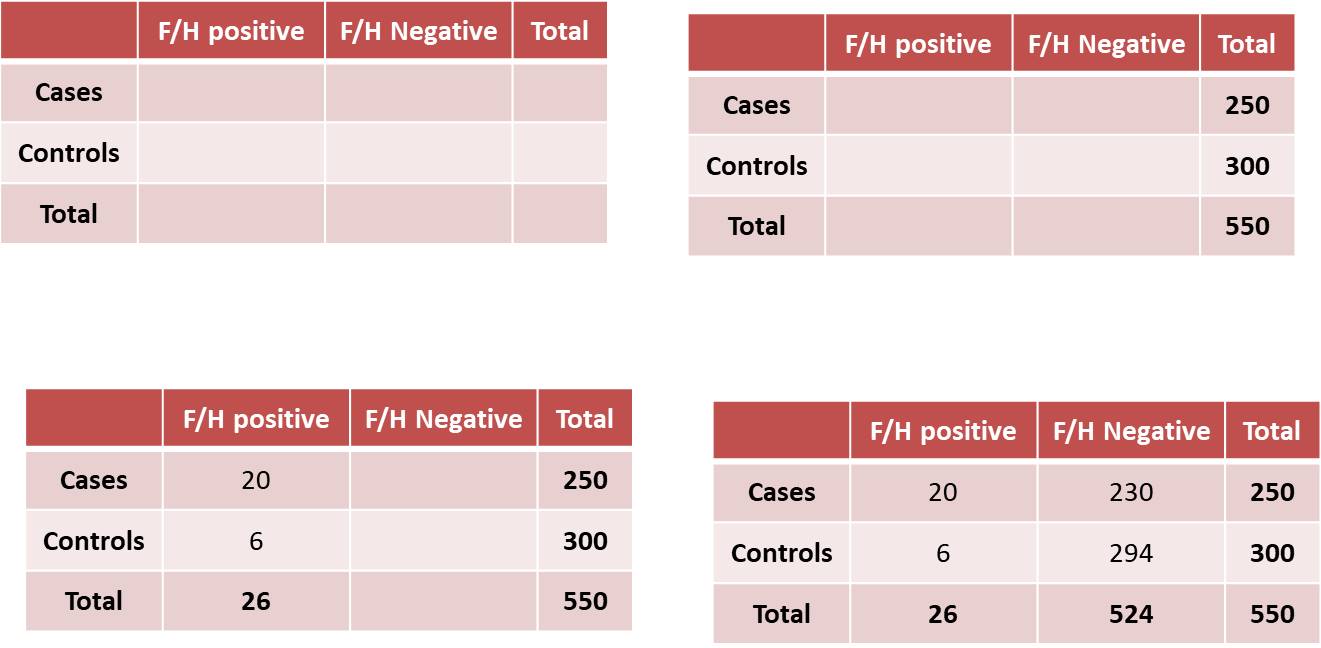
Step – 2: Determine the EXPECTED Value for Each Cell
Determine the expected value (E) in each cell, as if ‘null hypothesis (H0)’ was true.
Applying the proportion from the totals we calculate an expected value against each observed value.
Steps:
Calculate the combined positive F/H percentage:
Total with positive F/H: 20 + 6 = 26 & Total subjects: 550
26 out of 550 have +ve F/H i.e. 4.7 % of women in the total pool have a +ve F/H
The expected % should be the same in cases & controls, ie 4.7% each
Expected no of cases with a +ve F/H = 4.7/100 X no. of cases = (4.7)/100 X 250 = 11.75
Expected no of controls with a + ve F/H = 4.7/100 X no. of controls= (4.7)/100 X 300 = 14.1
؞ Expected no of cases with –ve F/H (total cases – cases with +ve F/H) = 250 – 11.75 = 238.25
Expected no of controls with –ve F/ (total controls– controls with +ve F/H) = 300 -14.1=285.9
Step-3: Calculate the Difference between the Observed and Expected Value (O- E) in Each Cell
Step-4: Calculate the x^2 for each cell: ![]()

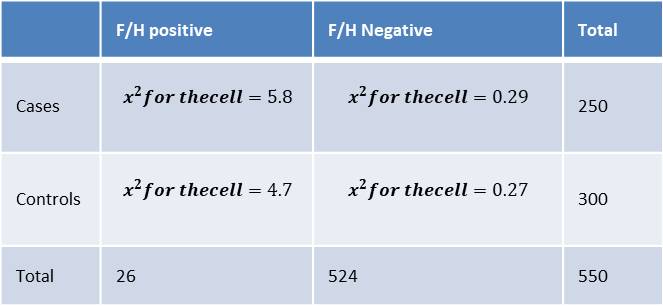
Step-5: Calculate the x^2 value for the Whole Table
Sum up the individual x^2 values of all the cells;
This is the value of x^2 for the whole table.
x^2value = 5.8 + 0.29 + 4.7 + 0.27 = 11.06
Step-6 : Determine the degree of freedom
d.f = degree of freedom = (c-1)(r-1); ‘c’ is the no. of columns and ‘r’ is the no. of rows in the table
D.f. = (c-1)(r-1) = (2-1)(2-1) = 1X1 = 1
Step-7: Refer to the x^2-table
Refer to the x^2-table and note that ‘x^2’ value which is:
Against the calculated degree of freedom and
Under the p-value = 0.05
At d.f. = 1 and p = 0.05, the value is 3.84 i.e. at one d.f. any value above 3.84 is significant
As our x^2 value is 11.06, p < 0.05,
The difference in the % of women with positive F/H is significant i.e. actually the cases have a higher % with positive family history
Hence we conclude that positive F/H and breast Ca are associated
Example 2 (More than 2 categories): Association b/w Maternal Age at Conception and Down’s Syndrome in the Offspring
1) 10,000 pregnant women in each age group were followed up till delivery and
2) The delivery of a baby with or without Down’s syndrome was noted
3) The results have been shown in the following table: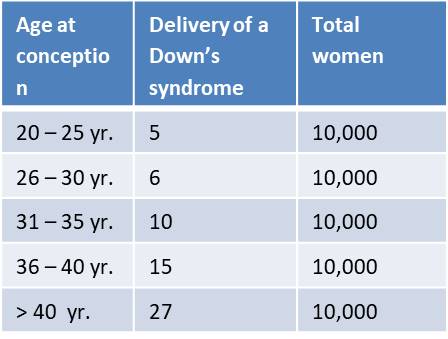
Step-1: Construct A Contingency Table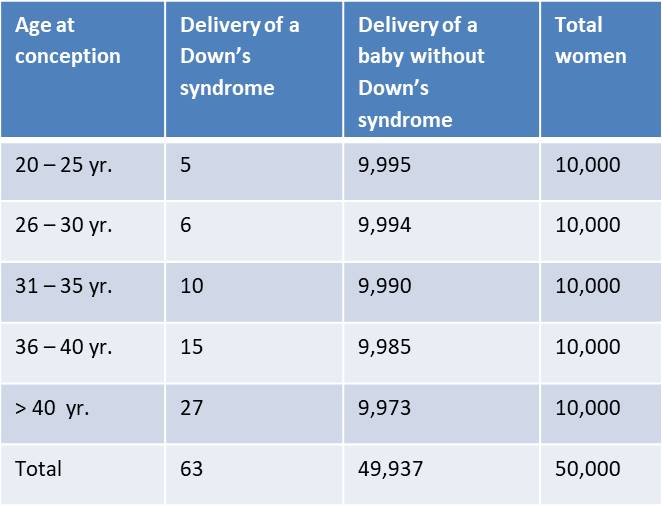
Step – 2: Determine the EXPECTED Value for Each Cell
Incidence of Down’s syndrome in TOTAL women is: 63/50,000 X100=0.13%
Incidence of ‘No Down’s syndrome’ in TOTAL women is: 49,937/50,000 X100=99.8%
Hence the expected value in ALL the cells with Downs’s syndrome column (as the total no. is the same i.e. 10,000 in all the groups)will be:
0.13/100 X10000(no. in each group)=13
Similarly, the expected value in ALL the cells with ,No Down’s syndrome’ column will be: 99.8/100 X10000(no. in each group)=9980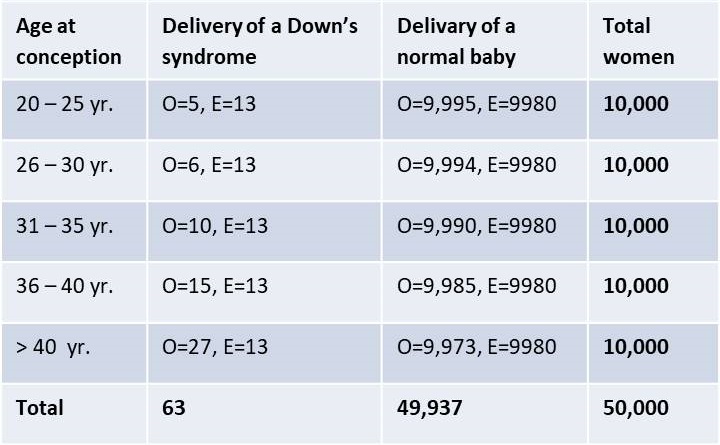
Step-3: Calculate the Difference between the Observed and Expected Value (O- E) in Each Cell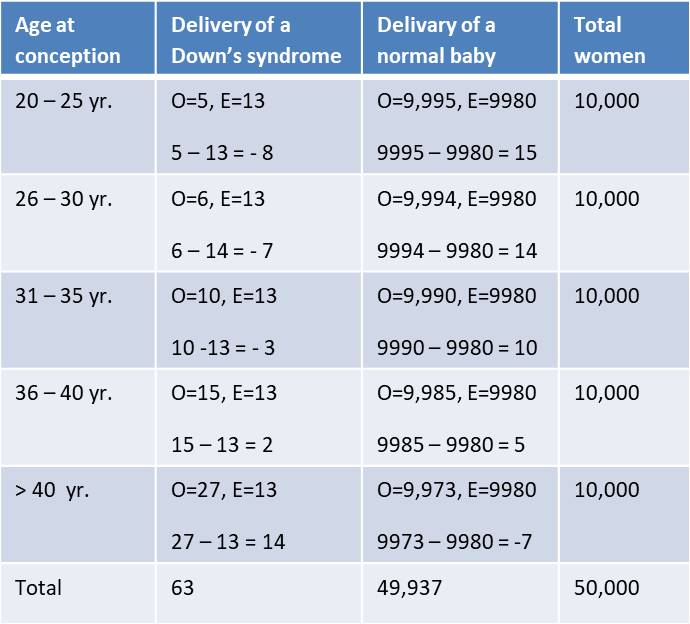
Step-4: Calculate the x^2 for each cell
x^2 for each cell = ![]()
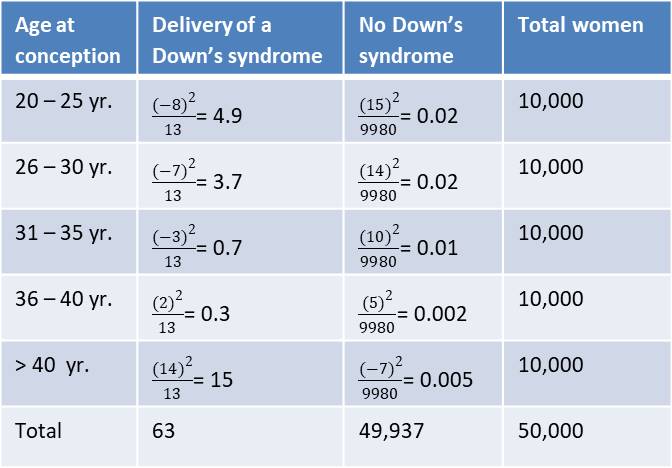
Step-5: Calculate the x^2 value for the Whole Table
Sum up the individual x^2 values of all the cells
This is the value of x^2 for the whole table.
x^2 = 4.9 + 3.7 + 0.7 + 0.3 + 15 + 0.02 + 0.02 + 0.002 + 0.005 = 24.66
Step-6 : Determine the degree of freedom
d.f = degree of freedom = (c-1)(r-1); ‘c’ is the no. of columns and ‘r’ is the no. of rows in the table
D.f.= (2 – 1)(5 – 1) = 1 X 4 = 4
Step-7: Refer to the x^2-table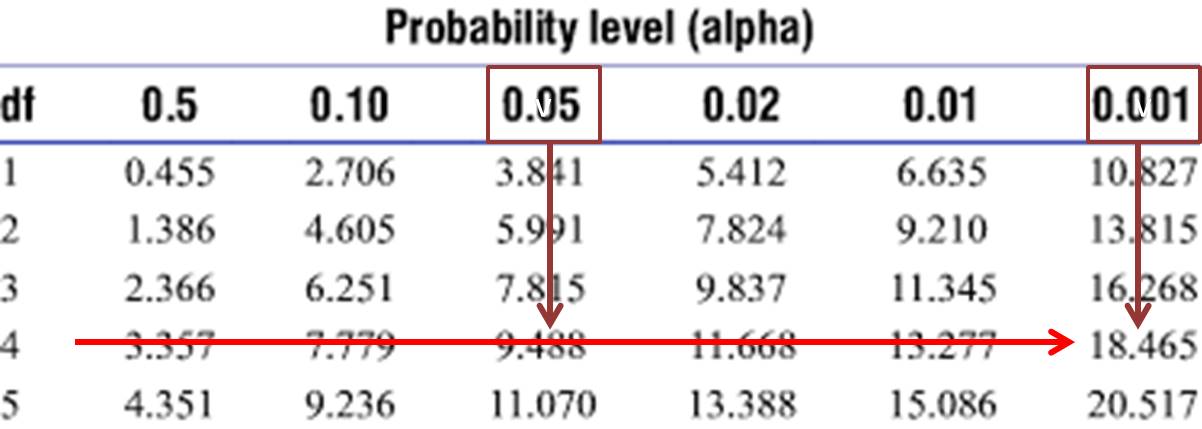
Refer to the x^2-table and note that ‘x^2’ value which is:
Against the calculated degree of freedom and
Under the p-value = 0.05
We observe that in the x^2– table, the x^2value against p=0.05 and d.f=4 is 9.488,
In fact, the x^2- value under p=0.001 and against d.f=4 is 18.465
Our x^2value of 24.66 is higher than this also
Hence, in this study, the p < 0.001 i.e. highly significant
Hence, maternal age at conception is found to be related to the incidence of birth of Down’s syndrome in this study
x^2 for 2X2 tables
If the contingency table turns out to be a 2X2 table i.e. 2 columns and 2 rows (excluding the ‘totals’)
(a+b) is the no. of cases, out of which a have the risk factor
(c+d) is the no. of controls, out of which c have the risk factor
N is the TOTAL no. of participants i.e. a+b+c+d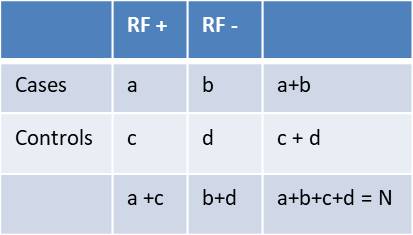
The x^2value can be calculated DIRECTLY using the formula:
Hence, for a 2X2 table the calculations of E no.s can be bypassed
However, if any cell frequency is 1,2,3 or 4 in the 2X2 table
The formula for the calculation of x^2 needs to be modified as below:
|ad-bc| is k/a modulus ad-bc, which means ignore the + or – sign
This is the ‘Yate’s correction’
Remember that if any cell value is ‘0’, then x^2-test CANNOT be applied even with Yate’s correction
If table is not 2X2 (i.e. > 2 categories), if a cell frequency is 0, x^2test CANNOT be applied
In this scenario, 2 or more classes may be merged to obtain higher cell value
References
The Chi squared tests, BMJ website: available at: https://www.bmj.com/about-bmj/resources-readers/publications/statistics-... accessed on 20th March 2020 at 4 PM
Tiwari P. Epidemiology Made Easy. New Delhi: Jaypee Brothers; 2003
K. Park. Health Information and Basic Medical Statistics; In: Principles of Epidemiology and Epidemiologic Methods. In Park’s Textbook of Preventive and Social Medicine. 25th Ed. Jabalpur: Banarasidas Bhanot, 2019
