The difference between the terms ‘Standard Deviation (SD)’ and ‘Standard Error (SE)’ may be confusing.
Both SD and SE are measures of variation but of two DIFFERENT factors. What are they?
Let us take an example:
We want to weigh a population of 10,000 workers in a factory.
The ideal way to do that would be to:
Weigh each one of the population of 10,000
Calculate the mean weight of the population i.e. Add up all the 10,000 weights and divide by 10,000.
This mean of the entire population under consideration is known as ‘Population Mean’ and is represented as µ
Wouldn’t that be a tedious work to do? A more convenient way would be to select a small sample (let’s say, 100 workers) from the population.
We need to ensure that this small group truly represents the entire population of 10,000. There are methods of sampling which ensure just that but are beyond the scope of present discussion. Hence we just assume that we have chosen a representative sample of 100 from the entire population of 10,000.
We weigh each of the 100 members of the sample and calculate the mean weight of the sample. This is known as the mean of the sample and is represented as  .
.
Further, we calculate the SD of the sample (using the individual weights recorded and the calculated sample mean).
It is natural that the sample mean, x ̅ would be similar to the population meanµ, but not identical to it.
If other researchers also take samples from the same population (can be of different sizes), each sample will give a different sample mean x ̅ . Nevertheless, all the x ̅ s be similar to the population mean µ but not identical to it.
This way we will have a collection of sample means which are more or less similar to the population meanµ, but some a little lower and others a little higher than the actual population mean.
Again if calculate the mean of all the sample means, that will be even more close to the actual population mean µ.
When we calculate the standard deviation of these sample means, we get the ‘Standard Error (SE) of the Means’ or simply the SE of the given population.
One needn’t wait for so many studies where samples are taken and a number of sample means are generated, for arriving at the SE of the population.
We can calculate the SE from the one representative sample that we have studied. How?
Simply divide the sample SD of the sample by square root of the sample size: SD/√n=SE , n=sample size which 100 in our example
Why do we need the SE of the population at all?
As discussed above, a representative sample gives a fair estimate of the population mean. Still it is just an estimate.
We need to calculate the SE of the given population to be able to say that the actual population mean µ, lies within the range of x ̅ +/- 2SE and we can say this with 95% confidence (beyond the scope of this discussion)
Hence when we examine a representative sample, we can arrive at a 95% confidence interval (CI) of  2SE from a single sample.
We can say with 95% confidence, that the entire population mean µ lies somewhere between the limits of x ̅-2SE and x ̅+2SE
In short:
Standard Deviation is a measure of dispersion of data WITHIN a single sample which is drawn from the population under study. It is calculated as square root of the variance (Steps for calculating the variance can be found in any standard textbook on statistics).
*It simply gives how far from the mean are the individual values in a sample. In simple words, how scattered is the data from the sample. Hence it is sample statistic.
Standard Error measures the dispersion of means in the study population.
*It estimates how varied the actual population mean µ may be from the sample mean. Hence it is a population parameter.
It is calculated as :SD/√n=SE, where n is the number of individuals in the sample and SD is the standard deviation of the sample
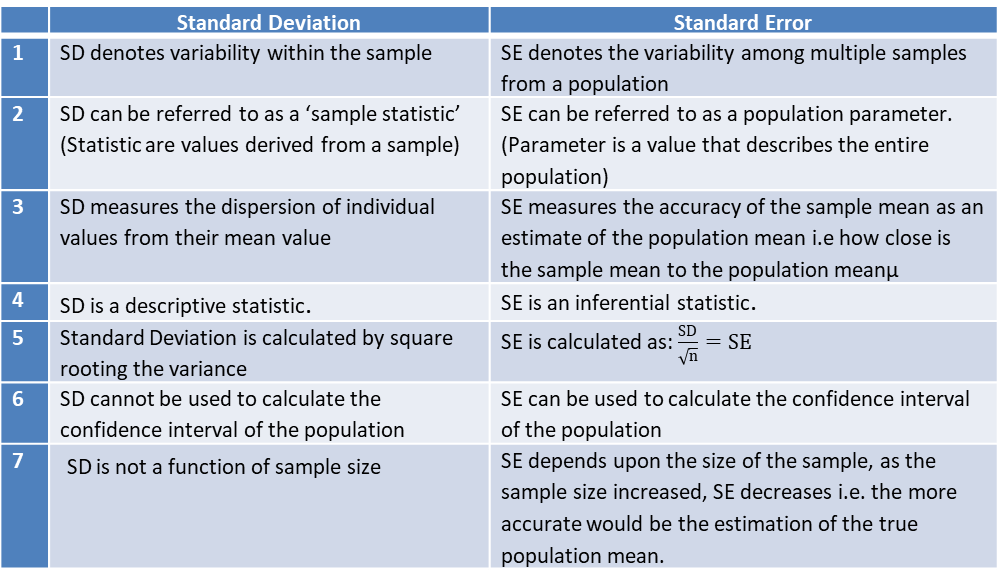
Differences b/w SD and SE
Both SD and SE are measures of variability. SD describes variability within a single sample and SE estimates the variability of means of multiple samples from the given population.
The differences are mentioned in the table below:
A large value SE would suggest that the population-mean, µ can exist within a very wide range, implying that the sample we have selected may not be truly representative of the study population
Larger the sample size, smaller would be the SE, hence a larger sample is more likely to be truly representative of the population under study.
References:
Altman, D. G., & Bland, J. M. (2005). Standard deviations and standard errors. BMJ (Clinical research ed.), 331(7521), 903. https://doi.org/10.1136/bmj.331.7521.903
BK Mahajan, 2018. Methods in Biostatistics: For Medical Students and Research Workers, 9th ed. Jaypee Brothers Medical Publishers, New Delhi
K Visweswara Rao, 2009. Biostatistics a Manual of Statistical Methods for Use in Health, Nutrition and Anthropology. Jaypee Brothers Medical Publishers, New Delhi
