For video lecture on this topic click below:
http://www.ihatepsm.com/resource/measures-central-tendency-and-dispersion
The term “average” implies a value, around which the other values are distributed in the given sample.
Commonly used averages are:
The ‘Mean’
The ‘Median’ and
The ‘Mode’
Mean:
The ‘mean’ (or the ‘arithmetic mean’) is widely used.
It is calculated by adding all the individual observations and then dividing by the number of observations. It is denoted by
The mean may be unduly influenced by extreme values in the distribution.
a) Mean for Un-grouped data
Let X = a single measurement
n = number of measurements under study
Mean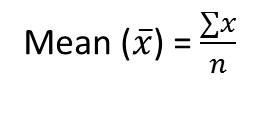
b) Mean for grouped data:
1. Simple frequency table
If duplicate measurements occur, the data may be simplified by arranging the data in the form of a simple frequency table, listing the frequency of occurrence of identical measurements. These frequencies may then be multiplied by the corresponding measurements in determining the sum.
Example:
Let f = frequency in each group
Then Mean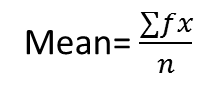
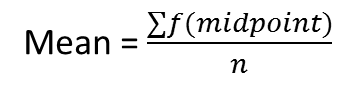
2. Frequency distribution in class intervals
The frequency table may be further simplified by grouping the observations into class intervals. Although the intervals need not necessarily be the same size, it simplifies the calculation whenever this can be done.
In calculating the mean from a frequency distribution classified in intervals the assumption is made that all values within a given class interval have the value of the mid-point of that interval.
The sum of the entire distribution is 'determined by adding the products obtained by multiplying the frequencies in each class interval by the mid-point of that interval.
The mean is then calculated by the usual method from the formula:
Median:
To obtain the median, the data is fist arranged in an ascending or descending order of magnitude, and then the value of the middle observation is called the median.
If there is an even number of values then the median is worked out by taking the average of the two middle values.
Mode:
The mode is the commonly occurring value in the data distribution of the sample. It is not affected by the extreme values. The disadvantage is that the exact location is often uncertain.
Measures of dispersion
The widely used measures of dispersion (or variation) are:
The ‘Range’
The ‘Mean Deviation’ (Average Deviation)
The ‘Standard Deviation’
The Range:
It is the simplest measure of dispersion.
It is defined as the difference between the highest and the lowest value.
If we have grouped data, the range is taken as the difference between the mid-points of the extreme categories.
The Mean Deviation
It is the average of the deviations from the arithmetic mean. It is calculated by taking the average of the absolute values (without regard to sign) of the deviations of the individual measurements from the mean.
It is given by the formula:
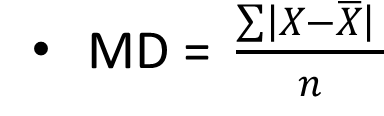
 , Indicates the deviation of the individual measurement from the arithmetic mean, ignoring the sign.
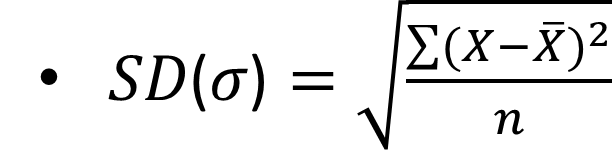
The Standard Deviation
It is the most frequently used measure of deviation. It is defined as ‘root-means-square-deviation’.
It is given by the formula: