WHY, Dietary Counselling?
• SAM = Severe Acute Malnutrition
• MAM = Moderate Acute Malnutrition
• Under-nourished children (MAM & SAM) have serious consequences
– Increased morbidity and increased risk of infections
– Increased mortality
– impaired physical and
– Impaired cognitive development, compromised IQ even in adulthood
– Develop into stunted adults
– Increased disease even in adulthood
– SAM is potentially life threatening as associated with complications
• Children with MAM are less wasted and generally do not have clinical complications associated with SAM,
– Highly vulnerable to proceed to SAM
• Compared to well-nourished children, children with MAM have a
– three-fold increased risk of mortality,
– Increased risk of infections
– Impaired physical and cognitive development and vulnerability to develop in to stunted adults associated with compromised IQ
• As far as MAM is concerned, Nutrition counseling, may be as effective as specialized food based interventions for the treatment
• Economic gains of $302 billion/year due to increased productivity associated with higher intelligence
Plotting the Weight on the Growth Chart


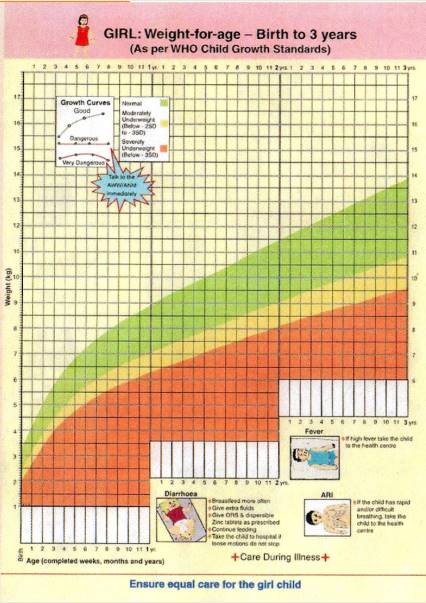
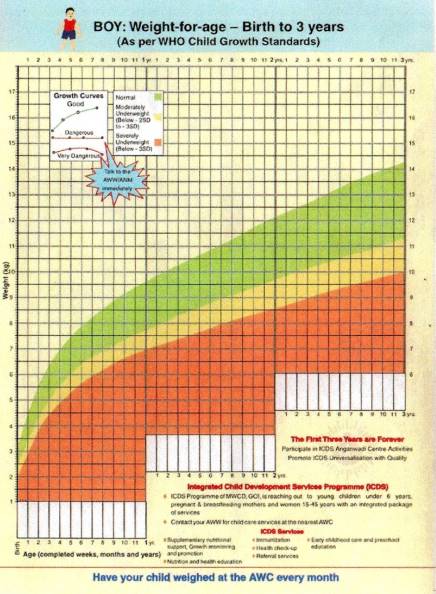
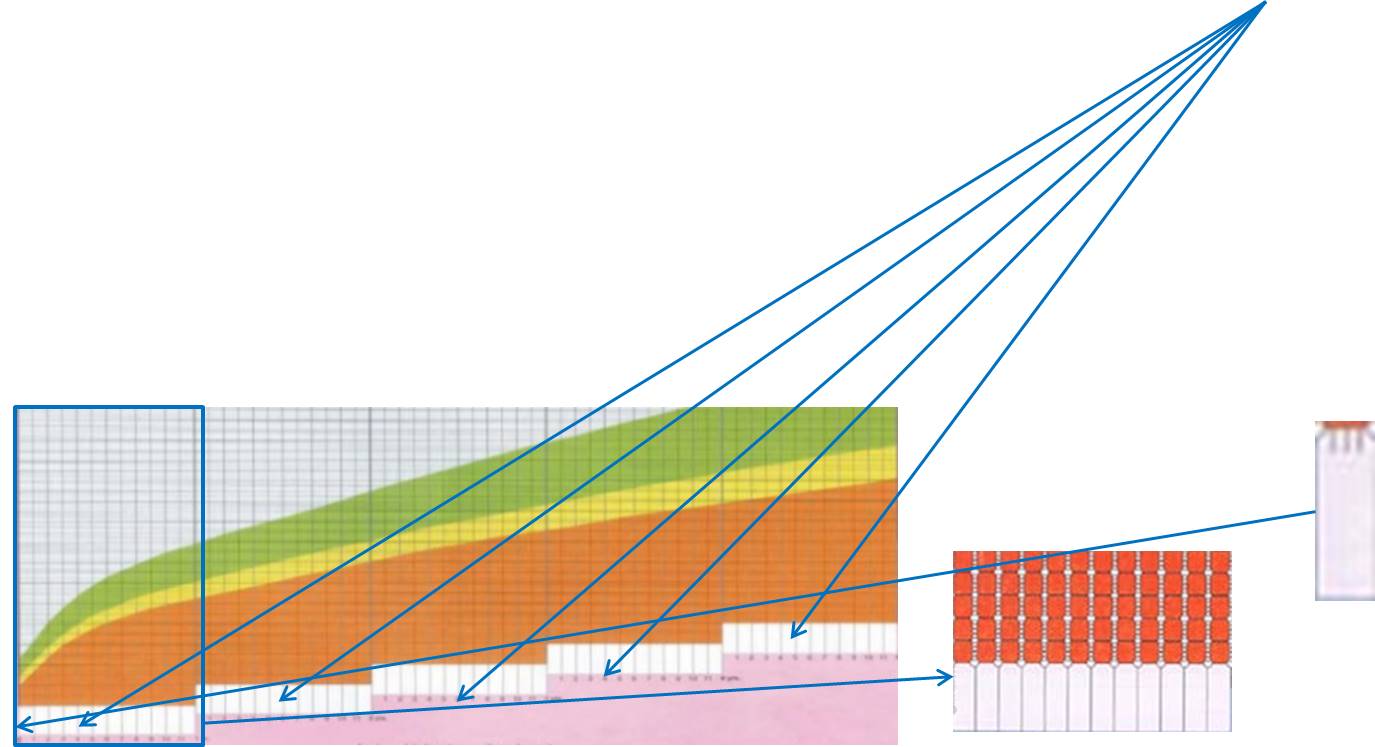
• One can see that the horizontal axis has five steps representing 1-5 years. Each step represents one year
• Each box contains 12 small squares representing 1-12 months i.e. each small square represents 1 month.
• The white rectangles are for writing the date in terms of the month and year
– On each visit, weight of the child taken is plotted, corresponding to the relevant rectangle.
• Age is recorded in completed months and year
• It is recorded in completed weeks only for a child below 1 month.
– Small lines dividing the first month into four weeks can be seen in the first square
– These need to be drawn upward for plotting weight as per the completed week
• On the vertical axis, lines are marked for recording weight in kilograms and grams.
– The thick line represents 1 kg
– The thin 500 grams and
– The very thin lines represent 100 grams.
• Plot Weights to the Nearest 100 gm;
Use pink border chart for girls and blue border chart for boys.
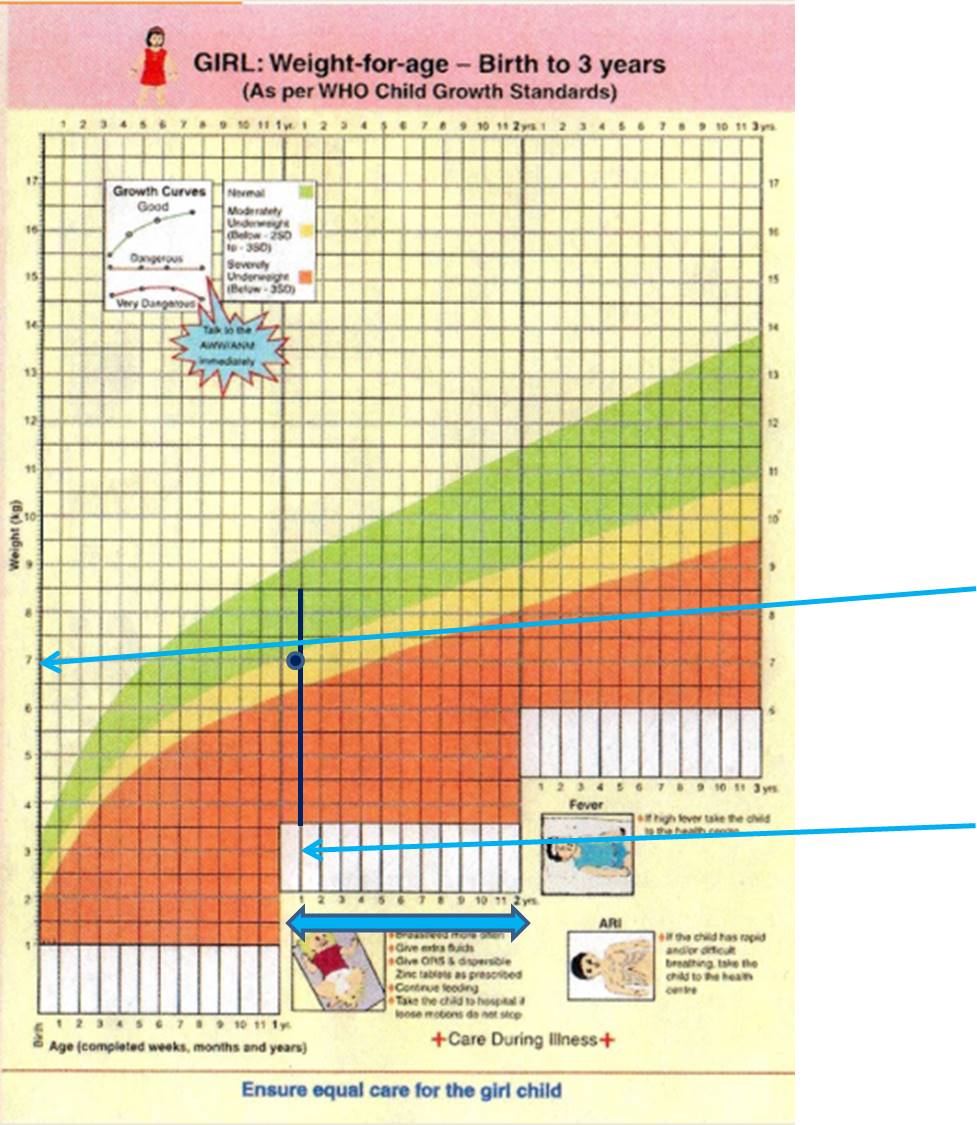
• Identify the completed number of years and choose the appropriate rectangle, then
• Identify the ‘month box’, which identifies the present age of the child in completed months
• Plotting has to be done on the lines for completed weeks/months
• Identify the horizontal line which indicates the present weight of the child to the nearest 0.1 kg e.g. 11.2 kg.
• Follow this horizontal line on the ‘weight axis’ towards right to the point where it intersects with the line which is extended from the vertical line from the ‘month box’ indicating the present age of the child
• Put a dot on the line where the two lines intersect.
E.g. A 1 year 1 month old baby with a weight of 7 Kg
INTERPRETING GROWTH CURVE
Growth curve on the Growth Chart makes the growth of the child visible to the family
• Direction of the growth curve indicates whether the child is growing or not
• An upward growth curve, showing adequate weight gain for the age of the child, indicates that the child is growing and is healthy.
• A flat growth curve indicates child has not gained weight and requires attention
• A downward growth curve indicates loss of weight and requires immediate attention by AWW and the family.
Determine SAM, MAM or Well Child
Plot the current weight on the gender specific growth chart
Determine if the child’s plotted weight is falling in green, yellow or red zone
If falling in green zone:
• Check for pedal edema
If falling below green zone:
• Measure the height/length and determine the z – score for ‘Weight for HEIGHT/Length’ (length for < 2 yr old; Ht for ≥ 2yr old)
– +0.7 cm if ht for < 2 yr old child; 0.7 cm if length for ≥ 2yr old
• Measure MUAC: < 12.5 cm implies acute malnutrition
• Look for bilateral pedal edema
Contact the medical officer for urgent intervention if the child is SAM (Severe Acute Malnourished):
• Wt for HEIGHT/L between ≤-3 and/or
• If MUAC < 11.5 cm OR
• If edema present
Steps in checking for edema:
• Grasp the foot so that it rests in your hand with your thumb on top of the foot.
• Press your thumb gently for approx. 10 seconds.
• The child has edema if a pit (dent) remains in the foot when you lift your thumb
The extent of edema is then rated as below:
• + mild: both feet
• + + moderate: both feet, plus lower legs, hands, or lower arms
• + + + severe: generalized oedema including feet, legs, hands, arms and face
Moderate acute malnutrition as Health workers will refer SAM to doctor and provide nutritional advice to MAM children
• It is defined by low weight-for-height/length Z- score between -3 SD and -2SD of the median WHO child growth standards, and/ or
• A mid-upper arm circumference of ≥ 11.5 cm to 12.4 cm, AND
• No edema.
Recommended Allowance for MAM
• 115 Calories/Kg per day
• 24 gm proteins/ 1000 Calories
For ease of calculating the recommended Calories for MAM, following table can be referred to:
Then assess the current intake of Calorie intake of the MAM child
Assess the Following
• Is the child breastfed? Consider calories only till 2 yr of age even if breastfeeding beyond 2 yr. DO NOT advice to discontinue BF.
• Assess how many meals the child takes
• Approximately how many calories:
– 24 hour recall
– Refer to calorie content of common foods
– Uncommon foods: try to assess the calories by asking/reading the ingredients and their amounts present in the food item
Remember to consider any dilution of milk with water; ask specifically before calculating the calorie and protein intake
– The diet is most likely to consists of 3 major meals i.e. breakfast, lunch and dinner and 2-3 snacks
• Calculate the energy/Calorie and protein gap
• Try to increase energy density of the already existing meals/snacks
• You may have to insert a specially prepared food if the energy gap is too high
Increasing Energy Density
• Recommended Calorie density for MAM is 150 – 200 Calories/ 100 gm food
– Definitely NOT be less than 100 Cal/100gm food
A high energy density can be achieved by
– reducing the water content of the food
– adding oils or
– sugar
• Reducing the water content will result in foods that are not easy for infants and young children to eat
• If sugar is added in high amounts, the osmolarity will easily become too high.
• Adding more oil to the diet will not have these negative effects, but the acceptability of adding considerably higher amounts of oil
Hence calculate and balance
For STUNTED Children:
• Children with stunting have smaller energy requirements than children with moderate wasting and therefore do not have the same need for foods with a high energy density.
• The energy density of their food probably should not be much higher than that of food for children without malnutrition.
• Energy densities between 1 and 1.5 Cal/g are recommended for infants and young children with stunting.
• Giving a diet with a high energy density for a long period to stunted children could potentially lead to obesity.
Choice of Food and Ingredients
1) High energy density
2) Adequate protein content
3) High protein quality and availability - animal-source foods
4) Adequate fat content: – Appropriate fat quality, especially high n-3/n-6 PUFA content
• Mustard/Canola oil
• Soyabean oil
• Flaxseed oil
• Fish oil; Inclusion of a small amount of fish, containing n-3 PUFA in the diet will make a great contribution; for lactating mother too.
5) Low content of anti-nutrients
6) Low risk of contamination
7) Acceptable taste and texture
– Culturally acceptable
– Easy to prepare
– Affordable and available
Lowering Anti-nutrients
• Soaking
• Germination and malting – legumes and grains
• Fermentation: lactic acid bacteria or yeast, multiply and produce a number of enzymes, which affect the taste, viscosity, and nutritional value of the product
– phytase is produced, which breaks down phytate
– Better vitamin B status
Micronutrients
• Cooking in iron pots
• Fermentation
• Green leafy vegetables (cooked to reduce volume)
• Fresh fruits – especially yellow and orange flesh
• Ensure all doses of vitamin A
• Multivitamin syrup
• Zinc tablet according to the age
Follow Up
• Follow – up Monthly
• Once > -2, decrease energy density to 1 – 1.5 Cal/gm or
– 100 – 150 Calorie/ 100 gm or
– 140 – 250 Calorie/ Katori or
– Just one additional serving of routine family food
• Refer to medical officer if there is no weight gain despite dietary compliance
References
• GOI, A Guide For Use of the Mother-Child Protection Card NIPCCD, New Delhi
• The Harmonised Training Package (HTP): Resource Material for Training on Nutrition in Emergencies, Version 2 (2011). NutritionWorks, Emergency Nutrition Network, Global Nutrition Cluster
• Proceedings of the World Health Organization/ UNICEF/World Food Programme/United Nations High Commissioner for Refugees Consultation on the Management of Moderate Malnutrition in Children under 5 Years of Age. Food and Nutrition Bulletin, vol. 30, no. 3 © 2009 (supplement), The United Nations University
• GUIDING PRINCIPLES FOR COMPLEMENTARY FEEDING OF THE BREASTFED CHILD . PAN AMERICAN HEALTH ORGANIZATION WORLD HEALTH ORGANIZATION
• UNICEF, European Commission, 2014. Management of Moderate Acute Malnutrition (MAM): Current Knowledge and Practice. CMAM Forum Technical Brief: September 2014
• S Tiwari, K Bharadva, B Yadav, Smalik, P Gangal, Cr Banapurmath et al. for the IYCF Chapter of IAP 2016. Infant and Young Child Feeding Guidelines. INDIAN PEDIATRICS; Volume 53,August 15, 2016: Pg 703 – 13
For Hindi lecture on Dietary Counseling Guidelines for Health Workers: http://www.ihatepsm.com/resource/dietary-counselling-guide-health-worker...
Terms used in Family Health Study: Definitions and Explanations: http://www.ihatepsm.com/blog/terms-used-family-health-study-definitions-...
